World Network of Biosphere Reserves (WNBR) of UNESCO

(04-Oct-2025)

Panna Tiger Reserve: From crisis to conservation

Why in the news?

The Cold Desert Biosphere Reserve (CDBR) in Himachal Pradesh has been included in World Network of Biosphere Reserves (WNBR) by the UNESCO, a global recognition that places the 7,770-sq km area spread across the state’s Lahaul-Spiti district on the international conservation map. With this addition, India now has 13 biospheres listed in WNBR.

Key takeaways:

  1. During the 37th session of UNESCO’s International Coordinating Council of theMan and the Biosphere (MAB) held in Paris, 26 new biosphere reserves across 21 countries the highest number in 20 years– have been added to the list of WNBR.
  2. The CDBR is spread across the Trans-Himalayan region. It encompasses the entire Spiti Wildlife Division and adjoining areas of the Lahaul Forest Division, including Baralacha Pass, Bharatpur, and Sarchu with altitudes ranging from 3,300 to 6,600 m.
  3. It integrates Pin Valley National ParkKibber Wildlife SanctuaryChandratal Wetland, and the Sarchu plains, encompassing windswept plateaus, glacial valleys, alpine lakes, and high-altitude desert, making it one of the coldest and driest ecosystems in WNBR.
  4. The Cold Desert is zoned intothree parts — core (2,665 sq km), buffer (3,977 sq km), and transition (1,128 sq km) — balancing conservation, sustainable use, and community participation. It is rich in herbs, shrubs, tree species, endemic species, wildlife and medicinal plants. Snow leopard as the flagship species reside here.

What is a Biosphere reserve?

  1. According to the Ministry of Environment and Forests, the Biosphere Reserves are meant to represent characteristic ecosystems in different biogeographic regions and consider human communities as their integral component. These are ‘learning places for sustainable development’.
  2. The objectives of the designation of a Biosphere Reserve include:
  3. ensuring in-situ conservation(at all levels of biodiversity ranging from genes to ecosystems) in totality as part of the wider ecosystem;
  4. widening the understanding(through research and monitoring) of components of ecosystems;
  • achieving integrated development(improved quality of life for indigenous communities living in and around) of the area.”
  1. A biosphere reserve comprises three zonescore(protected area that conserves ecosystems and species)buffer (managed for research and education), and transition (area where sustainable human activities are promoted in harmony with conservation goals).
  2. The idea of designation of Biosphere Reserves was initiated by UNESCO in 1973-74under its Man and the Biosphere (MAB) Programme. Launched in 1971 as an intergovernmental scientific initiative, MAB proposes an interdisciplinary research agenda and capacity building, aiming to improve the relationship of people with their environment globally.

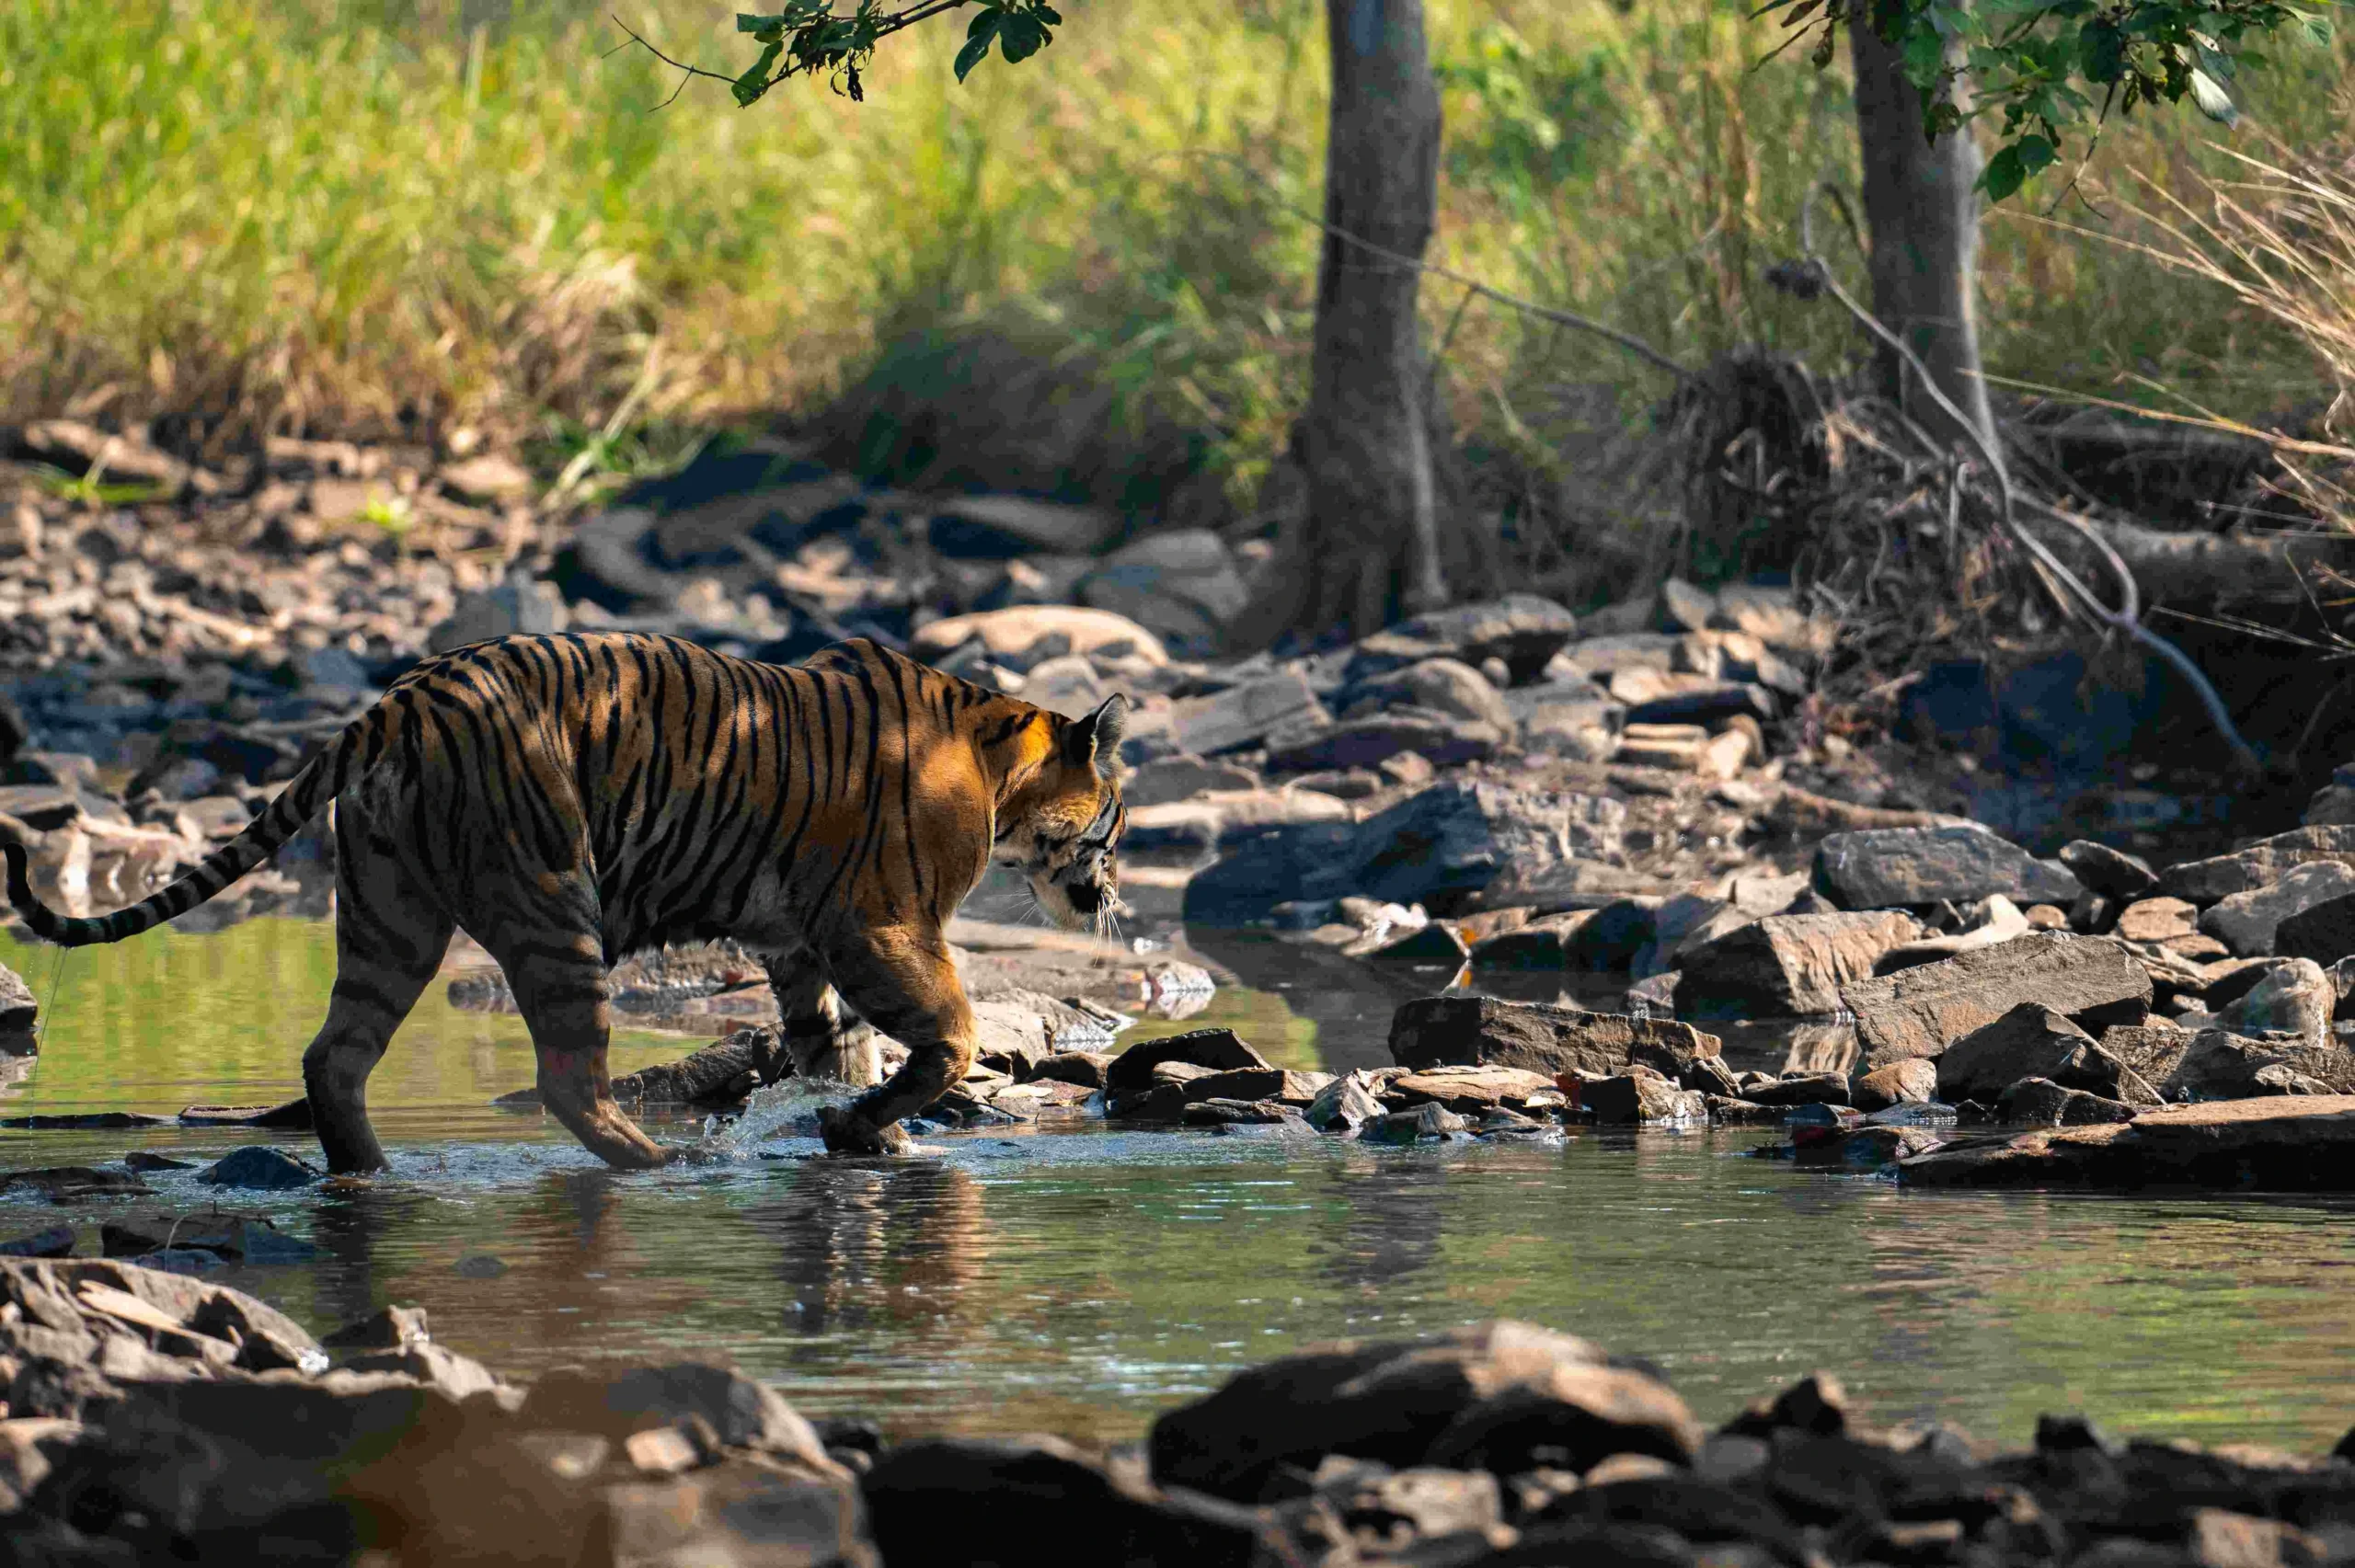
Still of Tiger from Nilgiri – A shared wilderness, a 75-minute-long documentary by Sandesh Kadur. Nilgiri is India’s first biosphere reserve.

  1. Biosphere reserves are nominated by national governments and remain under the sovereign jurisdiction of the states where they are located. After the launch of UNESCO’s MAB programme, the Indian Man and Biosphere (MAB) Committee identified potential sites for designation as Biosphere Reserves in 1979. As a result, the Indian National Biosphere Reserve Programme was initiated in 1986. Following the MAB guidelines, the Indian government has recognised18 biosphere reserves so far.
  2. The WNBR is a dynamic and interactive community of sites of excellence, managed by the Man and the Biosphere (MAB) Programme of UNESCO. For designating a site under WNBR, the government needs to propose it to UNESCO, which recognises it after it fulfills certain criteria. In India, 13 biosphere reserves are recognised in the WNBR.
  1. For the management of these biosphere reserves, the Indian government provides financial assistance through its Centrally Sponsored Biosphere Reserve scheme.The focus of the scheme is on the welfare of local inhabitants through the provision of supplementary and alternate livelihood support to the people in the buffer and transition zones in order to reduce biotic pressure on biodiversity of the natural reserves of the core zone.

Biosphere Reserves of India

There are 18 biosphere reserves in India. Nilgiri was the first biosphere reserve of India, established in 1986.


Biosphere Reserve

Designated

Inclusion Year in WNBR

State

Nilgiri

1986

2000

Tamil Nadu, Kerala and Karnataka

Nanda Devi

1988

2004

Uttarakhand

Nokrek

1988

2009

Meghalaya

Gulf of Mannar

1989

2001

Tamil Nadu

Sunderbans

1989

2001

West Bengal

Manas

1989

Assam

Great Nicobar

1989

2013

Andaman and Nicobar Islands

Simlipal

1994

2009

Odisha

Dibru-Saikhowa

1997

Assam

Dehang-Dibang

1998

Arunachal Pradesh

Panchmarhi

1999

2009

Madhya Pradesh

Khangchendzonga

2000

2018

Sikkim

Agasthyamalai

2001

2016

Kerala, Tamil Nadu

Achanakmar-

Amarkantak

2005

2012

Madhya Pradesh, Chhattisgarh

Great Rann of Kutch

2008

Gujarat

Cold Desert

2009

2025

Himachal Pradesh

Seshaschalam

2010

Andhra Pradesh

Panna

2011

2020

Madhya Pradesh


GDP Data

(04-Oct-2025)

The New Year Should See a Steady GDP Growth Rather Than a Spectacular One!  - Kanigas

Why in the news?

While official data show that India’s ‘real’ GDP growth has been on the upside more often than not, most of the big policy moves over the past couple of years have essentially been about giving some tax relief or the other in a bid to boost overall demand and raise India’s consumption levels

Key Takeaways:

  • If you are observing the Indian economy from a distance, something doesn’t add up. On the one hand, official data show that India’s “real” GDP growth — that is, after removing the effect of inflation — has been surprising on the upside more often than not.
  • And yet, on the other hand, if one moves away from the days when GDP data are announced, most of the big policy moves over the past couple of years have essentially been about giving some tax relief or the other in a bid to boost overall demand and raise India’s consumption levels.
  • First, in February 2023, in the year leading up to the General Election, the Union government raised the income tax exemption limit to Rs 7 lakhs per annum. Then, in February 2025, within a year of Prime Minister Narendra Modi coming back with a reduced mandate (the BJP lost 20% of its Lok Sabha seats in 2024), this exemption limit was raised to Rs 12 lakhs per annum.
  • Most recently, the Union government has — along with the state governments, which are also part of the GST Council — decided to cut GST rates as well.
  • Why are these two trends odd, you may wonder. Typically, when an economy grows at a fast pace, inflation is up because the overall supply of goods and services is unable to catch up with the high demand. Alternatively, when the demand in the economy is subdued, inflation cools down, and there is a need for policymakers to boost demand by means such as all kinds of tax cuts and interest rate cuts.
  • On the face of it, in India, growth is running hot, and yet policymakers of all hues are trying to boost demand.
  • What if one of the two trends is not really as robust as one might imagine? Of course, tax cuts are for real, and so are the government’s efforts to boost consumption and overall demand. So the obvious point of inquiry is the growth rate.
  • Typically, and for good reason, one looks at the real GDP growth rate. But real GDP is a number that is derived or calculated after removing the effect of inflation from the nominal GDP growth, which, as it happens, is the data that is actually collected.
  • The calculation of the real GDP growth rate has come under some cloud and questioning in the past few years.
  • The broader point is that many outside the government have claimed that the real GDP growth rate is overstating India’s economic momentum, while the government has claimed that detractors are trying to use the nominal GDP data in a bid to show weakness in India’s growth.
  • While looking at real GDP data is always the better thing to do when judging growth, it may be instructive to look at the trends of nominal GDP growth for at least four reasons.
  • One, it is the actual observed variable and, to that extent, it is less susceptible to being questioned.
  • Two, nominal GDP is the main benchmark for almost all the key economic variables in the country.
  • Three, soon the process of the next Union Budget will start, and the nominal GDP and its growth rate will be the starting point for all calculations.
  • Fourth, the nominal GDP does capture the demand story of the economy better than the real GDP, which maps the supply story better.
  • The deceleration in nominal growth rates, both for GDP as well as its two main components — private consumer demand and investment by businesses — is significant over the past two years. This may explain why, despite very strong real GDP growth rates, policymakers have been trying their best to boost consumption and investments.
  • While nominal GDP is not the best tool to compare long-term growth, primarily because inflation rates are significantly different and, as such, distort the picture, a look at this table does show the sharp slide in nominal GDP growth rates.
  • But if the nominal GDP growth rate starts to hover around 8% or 9%, it could quickly translate into a challenge for real GDP growth. That’s because — barring exceptional times or statistical anomalies — unlike developed countries, India’s economy will likely continue to have an inflation rate closer to 4%, at least for the retail consumer.

 Note:

GDP is the sum of the market value of all the final goods and services produced within the geographical boundaries of a country each year. The value of GDP measured in current prices is called Nominal GDP but it might not be a good measure of production because the increase in value may result from an increase in prices and not output. Nominal GDP, adjusted for price changes, is called Real GDP.

Nominal GDP per capita = Nominal GDP/total population

Real GDP per capita = Real GDP/total population

Furthermore, economists rely on three approaches to accurately measure GDP: Expenditure, Income, and Product. GDP calculated from all these approaches should give the same value.

Personal consumption expenditure is the sum of expenditure on consumer durables, non-durable goods, and services.

Gross private domestic investment is the total of business fixed investment (non-residential structure, equipment, and software), residential investment and inventory investment.